The world of cryptocurrency remains one of the most dynamic and unpredictable markets today. Traders and investors constantly seek reliable tools and insights to navigate its volatile waters. Among the many platforms available, Trading View stands out as a comprehensive charting and analysis tool that empowers users to identify support and resistance levels, visualize price movements, and execute informed trading decisions. This article delves into recent market developments, especially Bitcoin's movement around the critical $80,000 level, and explores how advanced charting techniques using Trading View can help traders anticipate future price actions.
Understanding Bitcoin's recent rally and key levels can give traders an edge when assessing market sentiment. The cryptocurrency recently experienced a significant dip below the $80,000 mark, plunging to lower supports around the $60,000–$65,000 range. From this support zone, Bitcoin staged an awkward but noteworthy rally, challenging previous resistance levels within the $70,000 to $80,000 range. Interestingly, on the Trading View charts, previous support levels are now acting as resistance, illustrating classic technical analysis dynamics. As traders analyze these shifts, tools like Trading View become indispensable in pinpointing levels of interest, charting trends, and understanding the market’s psychology.
Through this article, we will explore how traders leverage advanced chart analysis, understand market-influencing factors, and interpret key technical signals within the context of Bitcoin’s recent movements. We will also highlight the importance of awareness about support and resistance zones and how visual tools offered by Trading View help traders develop strategic insights. Whether you're a seasoned trader or new to crypto markets, comprehending these technical nuances can significantly enhance your trading approach and risk management strategies.

Support and resistance are foundational concepts in technical analysis, critical for understanding and predicting market price actions. When Bitcoin declined from its peak levels above $80,000, market participants watched closely as it approached the $60,000–$65,000 support zone. This level acted as a cushion for the price, preventing an even steeper decline and signaling strong buying interest around that zone.
Support levels are identified as price points where buying pressure tends to enter, halting or slowing a downtrend. Conversely, resistance levels indicate where selling pressure tends to emerge, capping an uptrend. On Trading View, traders analyze historical price data to map these zones, often employing various charting tools such as horizontal lines, trendlines, and volume profiles. When Bitcoin's price hit the lower support at $60,000–$65,000, it reflected an area of significant demand, often coinciding with major moving averages or Fibonacci retracement levels.
The psychological importance of these levels is profound, as they tend to become self-fulfilling prophecies—market participants place buy or sell orders around these zones, reinforcing the support or resistance. In recent observations, Bitcoin’s rally from the support zone towards the $70,000 range suggested renewed bullish momentum. However, as it approached the previous support that had now become resistance, it faced a significant hurdle, testing the resolve of bullish traders. This behavior exemplifies the importance of visual analysis tools like Trading View, which allow traders to mark these levels clearly, set alerts, and visualize potential breakout or rejection scenarios.
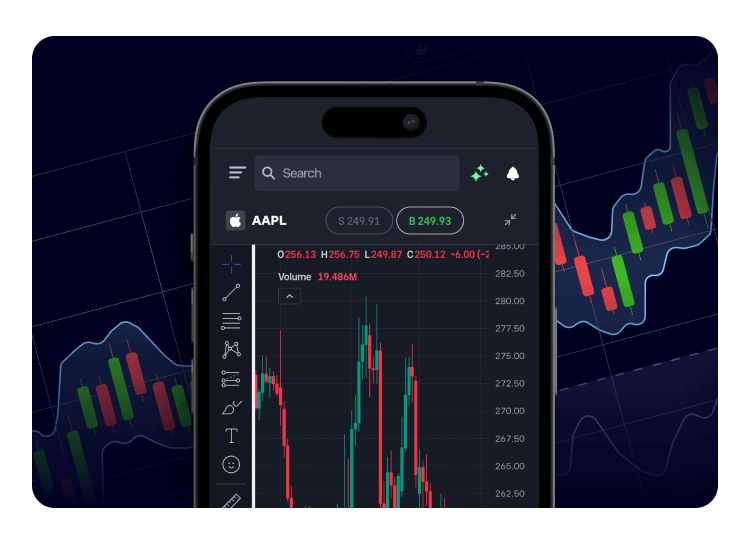
Trading View’s advanced charting platform offers a suite of tools that help traders identify potential turning points in market trends. Recognizing whether a support or resistance level will hold or break is crucial for executing timely trades. The platform’s intuitive interface allows for the application of various technical indicators and drawing tools that enhance the clarity of price action.
One effective method to confirm support or resistance is through volume analysis. When Bitcoin approached a key resistance zone within the $80,000 range, increased trading volume often signaled the exhaustion of buying pressure or the onset of a reversal. Using Trading View’s volume profile tools, traders can assess the amount of activity at different price levels to determine whether a zone is strongly defended or likely to be broken.
Additionally, oscillators such as RSI (Relative Strength Index) or MACD (Moving Average Convergence Divergence) assist in confirming overbought or oversold conditions, which can precede reversals. For example, traders observing Bitcoin nearing the previous support that turned into resistance might wait for signals like a bearish divergence in MACD or RSI to inform their entries or exits. Customizable alerts in Trading View further allow traders to be notified when price approaches critical levels, ensuring timely action without constant surveillance.
The combination of visual support/resistance recognition, volume analysis, and momentum indicators forms a robust technical framework. Trading View’s detailed chart annotations enable traders to plan their trades effectively, set stop-loss orders just beyond support or resistance levels, and prepare for potential breakout scenarios. This strategic approach transforms raw data into actionable insights, giving traders a decisive advantage in volatile conditions.

While technical analysis provides valuable insights, external macroeconomic factors and market sentiment also play significant roles in Bitcoin’s price dynamics. Over the past months, geopolitical tensions, inflation concerns, and regulatory developments have impacted investor behavior, often amplifying price swings.
In recent market movements, the falling below the $80,000 level may have been driven by a combination of profit-taking, macroeconomic uncertainties, and shifts in institutional interest. Conversely, the rally back from the $60,000–$65,000 support zone indicates a resilient buyer base willing to re-enter the market at perceived attractive levels. Market sentiment, often measured through news flow, social media activity, and sentiment indexes, influences traders’ willingness to buy or sell at key levels.
Understanding these external influences alongside technical levels is vital for comprehensive market analysis. Traders leveraging Trading View can incorporate additional data sources such as fundamental news events or sentiment indicators directly into their charts. Cloud-based news feeds or sentiment graphs help contextualize price movements, leading to more nuanced strategies that account for both human psychology and technical signals.
Furthermore, external factors may cause rapid shifts that break support or resistance levels unexpectedly. For instance, a significant regulatory announcement or a macroeconomic shift could quickly invalidate technical patterns. Therefore, traders should stay vigilant and consider complementing technical signals with news monitoring tools integrated into their analysis workflow to mitigate risks and seize opportunities promptly.

Effective trading around key technical levels requires a disciplined strategy, combining insights from support and resistance, volume, momentum, and external news. Using Trading View, traders can develop tailored approaches to maximize gains and minimize risks.
A popular approach is to use support and resistance zones as entry or exit points. For example, traders might buy near strong support levels like the $60,000–$65,000 zone, setting stop-loss orders just below that point to manage downside risk. Conversely, they could take profits when the price approaches established resistance levels around $80,000 or higher, anticipating a potential rejection or consolidation.
Another valuable tactic involves breakout trading, where traders wait for the price to break through resistance with increased volume, signaling a new upward trend. Conversely, rejection at resistance levels may warrant short positions or profit-taking. Trading View helps facilitate these strategies through customizable alerts that notify traders of breakouts, retests, or key indicator signals.
Additionally, incorporating oscillators such as RSI or Bollinger Bands can refine decision-making. For instance, a Bitcoin rally toward resistance accompanied by an RSI nearing overbought conditions might suggest caution or the prepping of a pullback. Conversely, divergence signals could warn of weakening momentum before a reversal. By integrating these tools within Trading View, traders craft a comprehensive, data-driven approach that adapts to market conditions dynamically—enhancing their ability to trade with confidence amid volatility.
Navigating Bitcoin’s recent movements around critical levels highlights the importance of robust technical analysis and the utility of advanced charting platforms like Trading View. Recognizing support and resistance zones, analyzing volume and momentum, and staying aware of market sentiment are essential for developing an effective trading strategy. As the market continues to evolve, traders who leverage these insights—supported by Trading View’s powerful tools—can better anticipate price reversals, breakout opportunities, and risk management opportunities. Ultimately, combining technical acumen with external awareness forms the foundation of a resilient trading approach, empowering traders to adapt and succeed in this ever-changing landscape.